Original Reflection Page
For this assignment, we created a summary and reflection of our project, the process that we went through, and explained our key decisions. We started by describing our main goal, and the process of selecting the data spreadsheet that we did, and our reasoning behind it. We also described what we were looking for specifically when we had our dataset, and why. We also described our major insights that we found from the data, and the significance of those insights. Furthermore, we described how these insights can be used, and who they can assist. We also provided a link and screenshots to our original spreadsheet.
Why We Chose What We Chose, & Our Goal
For our Final Dataset Project we decided to look at the KU Parking Citation dataset with a goal to figure out the most common times and reasons for citations here at KU. To do this we first had to access the dataset and the citation dataset given to us by KU Parking. With this information we organized and transformed the spreadsheet to collect the data we needed for this project.
This large dataset was organized in a spreadsheet providing us with the structure needed to analyze the data. We faced challenges because having such a large dataset it was hard to pinpoint the exact data we needed to collect. To make sure we had accurate data we took this information into Excel and underwent a deep cleaning with the dataset.
Five Key Parts
After cleaning the data we realized we had to find five things, the day of the week the citations took place, the reason the citations took place, the parking lot in which the citation was issued, what citations were paid and unpaid, and lastly if class was in session or not.
In excel we broke down our five needs and collected the data we needed individually.
Five Needs
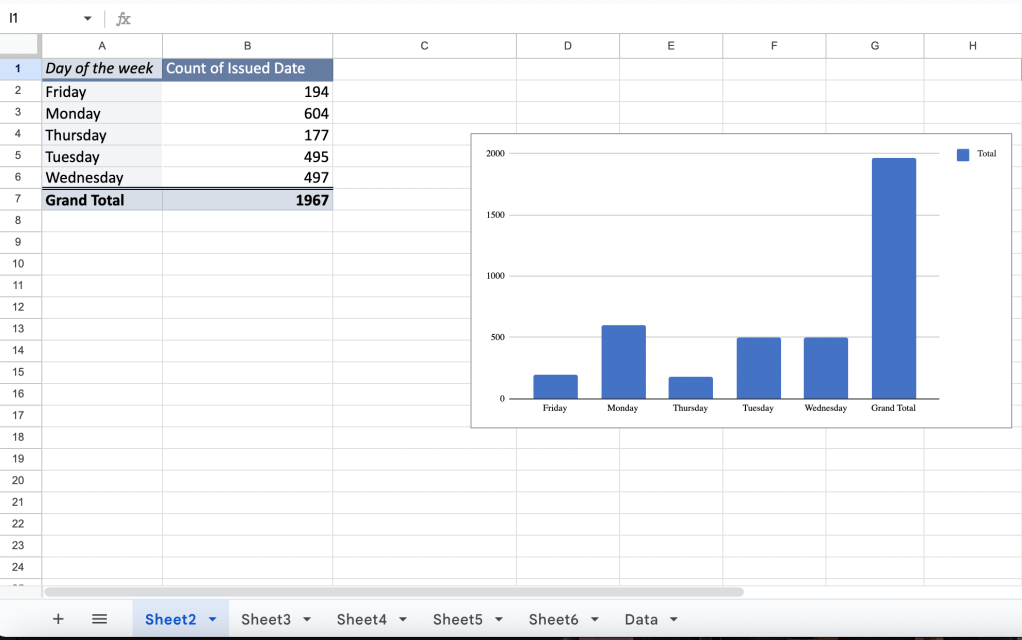
- First off to find the days of the week the citations were issued we sorted and filtered the day of the week to into its own column to then count and see how many citations were given out each weekday.
- When trying to collect data on the reasons the citations were issued we filtered the reason column in excel and found out there were two reasons for parking citations, the first reason was not having a valid permit, and the second reason was parking in unauthorized lots such as red staff lots.
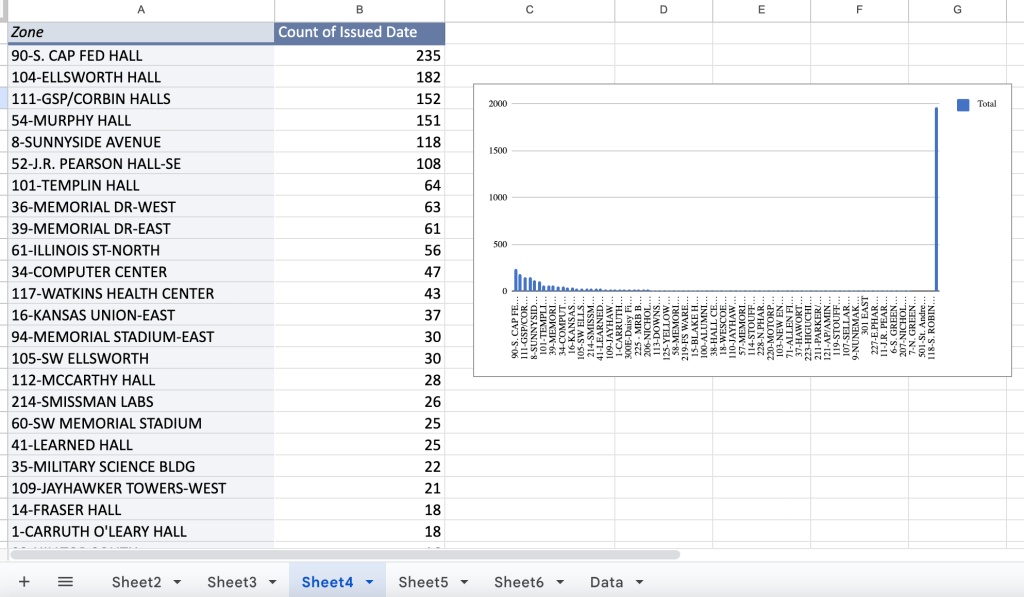
- We ran into some challenges when trying to collect data on what parking lot the citations were issued, we ended up using the dataset provided to break down the pivot charts and filtered the dataset only to show the last 3 weeks of August, that way we could simplify the dataset and find the information we needed. With that given information we sorted the specific variables we used for our insights.
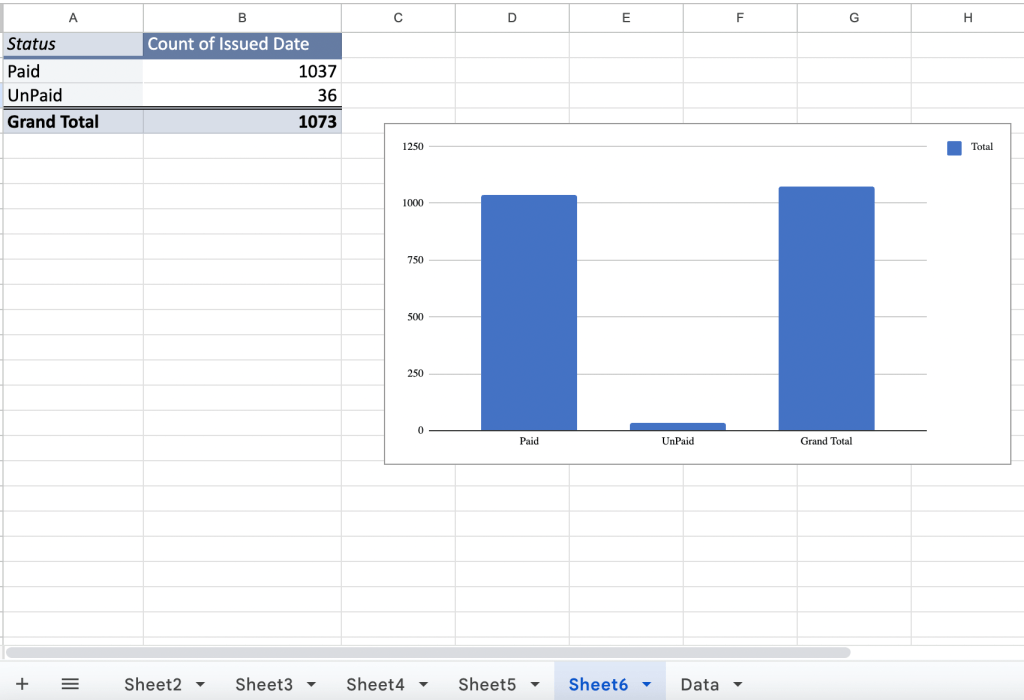
- After that we needed to find information on if these tickets were paid or unpaid, after looking at the dataset we realized a large sum of the citations were voided, so we ended up filtering all of the voided tickets and ended up sorting the paid and unpaid tickets into columns of their own and collected our data from their.
- Lastly we had to figure out if this was during class hours or not, this process was simple to collect because we sorted out all of the days class were in session vs not in session and gathered our data from that filter.
Trends
After gathering that data we were able to observe trends with KU parking citations that allowed us to highlight the key findings that we sought out to find. Some of the major findings we found was: Monday was the most common day for citations. We think this is the case because many students have class on Mondays and the start of the week can be hectic for people. We also found that citations most commonly occur due to individuals parking in staff parking lots. Another key finding was that the majority of citations come from common parking zones at KU such as the Capital-Federal Hall Parking Lot, and the Ellsworth Hall parking lot. We believe this to be the case because it sees the most amount of students coming in and out daily. Another insight is that the vast majority of citations occur when class is in session. We think this is due to the fact that most students are on KU’s campus to attend class. The last key finding is that almost all of the citations that were handed out resulted in the tickets being fully paid. We think this is due to the enforcement of citations by KU Parking staff.
Major Insights
Our three major insights is that with the amount of citations given due to unauthorized parking KU should try to make those lots more clearly labeled as unauthorized so that way students can avoid the confusion and avoid ending up with a citation. KU should encourage its students to park in less populated lots, thus making lots like Cap-Fed and Ellsworth Hall less hectic. Because of the amount of tickets handed out during class we encourage KU to adjust parking regulations that would relax parking restrictions during the busiest times of the day.
Solutions that could be put in place:
- KU could explore expanding parking facilities and adjust in class times to lower the parking demand during the busiest hours of the day
- KU could redesign parking zones to allow more spaces for students
- KU could increase its bus services to make less people have to use campus parking
- KU could offer a digital daily parking pass that would lower non-permit violations
- KU could also modernize its lots so you could be able to see how many spots are available before a student makes their commute
After creating our parking story in google docs, we created visuals on Adobe Illustrator and Flourish to convey our data in a clear and simple way for our audience to observe. We also included interviews with students to get a first hand understanding of these issues. We had two student stories, two bar charts, and three pie/donut charts to demonstrate our data.
The target audience for this Final Project is KU students and staff who park on campus, this is so we can see what the people who use this service think could be improved.
The tools we used for this project were Excel, Google Docs, Google Slides, Adobe Illustrator, and Flourish Studio.
Throughout this project, we all worked collectively. Harrison came up with the idea and helped guide Josh and JJ through the data collection. We would meet up every other Wednesday and talk about our project and new ideas. We each created our own visuals and worked to come up with clear understandable data that conveyed a message our audience would care about.